
Streamlit is so cool. After scanning through their documentations and api, as always we will build a simple Exploratory Data Analysis (EDA) app using streamlit in python. We will be building one for the famous iris dataset. First of all what is streamlit?
Streamlit is a great framework for building ML tools with speed. It is the fastest way to build custom machine learning and data science apps.It comes as a package and a CLI for running your app.
From their official website , it is defined as ‘the first app framework specifically for Machine Learning and Data Science teams‘
It offers so much benefits and features with clarity. All you need is to import the package and start.
Ok, too much of the talking ,let us explore this framework and then move on to building our EDA app.
Installation
pip install streamlit
To explore the CLI, you can fire up your terminal and then type
streamlit --help
To run your app or python script, all you need is to add the run command to the streamlit and then your app as below
streamlit run app.py
Let us begin with our app. We will create a file called app.py. This is where we will write all our code. We do not need a front-end or html file to render the result. Streamlit will take care of that for us.
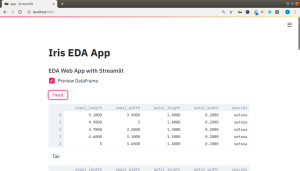
This is what we will be building
The main code you need to is to import the streamlit module and wrap them around your python code as below.
import streamlit as st
name = "Iris App"
st.text(name)
Then run your script with the CLI as
streamlit run app.py
This will automatically open your default browser with your localhost on mostly port 8501 or any available port. And that is all, you will see the result of your script. Fascinating!
You can make plots, display images,videos,audios, dataframes, tables and many more.
You can check the video below for how each of these are done or their docs.
Building The Iris EDA App
As we have seen how it works, we will move on to building our EDA app. The structure of the app is as follows
- Preview Our Dataset with df.head() or df.tail()
- Show Our Columns with df.columns
- Show the Entire Dataset
- Select Columns
- Show Summary of Dataset
- Make Data Visualizations eg Correlation Plot,Bar Plots,Area Plot,etc
- Manipulate the Iris Species Images
Below is the code for the entire app
# Import our Pkgs
import streamlit as st
import pandas as pd
import numpy as np
import os
import matplotlib.pyplot as plt
import seaborn as sns
from PIL import Image,ImageFilter,ImageEnhance


# Title and Subheader
st.title("Iris EDA App")
st.subheader("EDA Web App with Streamlit ")


# EDA
my_dataset = "iris.csv"

# To Improve speed and cache data
@st.cache(persist=True)
def explore_data(dataset):
	df = pd.read_csv(os.path.join(dataset))
	return df

# Our Dataset
data = explore_data(my_dataset)

# Show Dataset
if st.checkbox("Preview DataFrame"):

	if st.button("Head"):
		st.write(data.head())
	if st.button("Tail"):
		st.write(data.tail())
	else:
		st.write(data.head(2))

# Show Entire Dataframe
if st.checkbox("Show All DataFrame"):
	st.dataframe(data)

# Show Description
if st.checkbox("Show All Column Name"):
	st.text("Columns:")
	st.write(data.columns)

# Dimensions
data_dim = st.radio('What Dimension Do You Want to Show',('Rows','Columns'))
if data_dim == 'Rows':
	st.text("Showing Length of Rows")
	st.write(len(data))
if data_dim == 'Columns':
	st.text("Showing Length of Columns")
	st.write(data.shape[1])


if st.checkbox("Show Summary of Dataset"):
	st.write(data.describe())

# Selection
species_option = st.selectbox('Select Columns',('sepal_length','sepal_width','petal_length','petal_width','species'))
if species_option == 'sepal_length':
	st.write(data['sepal_length'])
elif species_option == 'sepal_width':
	st.write(data['sepal_width'])
elif species_option == 'petal_length':
	st.write(data['petal_length'])
elif species_option == 'petal_width':
	st.write(data['petal_width'])
elif species_option == 'species':
	st.write(data['species'])
else:
	st.write("Select A Column")

# Show Plots
if st.checkbox("Simple Bar Plot with Matplotlib "):
	data.plot(kind='bar')
	st.pyplot()


# Show Plots
if st.checkbox("Simple Correlation Plot with Matplotlib "):
	plt.matshow(data.corr())
	st.pyplot()

# Show Plots
if st.checkbox("Simple Correlation Plot with Seaborn "):
	st.write(sns.heatmap(data.corr(),annot=True))
	# Use Matplotlib to render seaborn
	st.pyplot()

# Show Plots
if st.checkbox("Bar Plot of Groups or Counts"):
	v_counts = data.groupby('species')
	st.bar_chart(v_counts)


# Iris Image Manipulation
@st.cache
def load_image(img):
	im =Image.open(os.path.join(img))
	return im

# Image Type
species_type = st.radio('What is the Iris Species do you want to see?',('Setosa','Versicolor','Virginica'))

if species_type == 'Setosa':
	st.text("Showing Setosa Species")
	st.image(load_image('imgs/iris_setosa.jpg'))
elif species_type == 'Versicolor':
	st.text("Showing Versicolor Species")
	st.image(load_image('imgs/iris_versicolor.jpg'))
elif species_type == 'Virginica':
	st.text("Showing Virginica Species")
	st.image(load_image('imgs/iris_virginica.jpg'))


# Show Image
if st.checkbox("Show Image/Hide Image"):
	my_image = load_image('iris_setosa.jpg')
	enh = ImageEnhance.Contrast(my_image)
	num = st.slider("Set Your Contrast Number",1.0,3.0)
	img_width = st.slider("Set Image Width",300,500)
	st.image(enh.enhance(num),width=img_width)


# About

if st.button("About App"):
	st.subheader("Iris Dataset EDA App")
	st.text("Built with Streamlit")
	st.text("Thanks to the Streamlit Team Amazing Work")

if st.checkbox("By"):
	st.text("Jesse E.Agbe(JCharis)")
	st.text("Jesus Saves@JCharisTech")
The full code is on github.
You can check the video for a full walkthrough of the entire tutorial below.
Streamlit is so cool. The Streamlit team has done a great work.
Thanks For Your Time
Jesus Saves
By Jesse E.Agbe(JCharis)