Python is popular in the data science world. It has several libraries and packages for performing data analysis, data visualization, machine learning,deep learning and also for converting your models into product.
Certain libraries like Pandas, Scikit-learn, Tensorflow, PyTorch, Flask, Streamlit and Plotly made Python very useful for Data Scientist and Data Engineers.
JavaScript on the other hand is know for everything in the browser, it can be use to build website – static and dynamic, useful for server side activities via Nodejs and even for building mobile applications via react native, P.W.A,Ionic and more. Is it also possible to use JavaScript for data analysis?
Yes, definitely , there are several libraries and packages we can use for data analysis. In this tutorial we will be exploring Data-Forge.js – a powerful yet easy to use library for data manipulation with a similar learning curve like Pandas.
By the end of this tutorial you will learn
- Some Javascript Libraries for Data Science
- How to create dataframes with Data-Forge
- How to work with CSV files in Data-Forge
- Data Analysis and Data Wrangling in Javascript.
- etc
JavaScript Packages and Libraries For Data Science
We will group the libraries and packages according to the various domains of data science.
Data Visualization
- Data-Driven-Documents(D3.js)
- Sigma.js
- Aperture JS
- InfoVis
- Cytoscape.js
Data Manipulation
- Data-Forge
- DataSet
- TableTop (parsing of CSV data)
Statistics
- jStat is a library for statistical data analysis.
- Science.js
- Sylvester
- Gauss
Machine Learning
- brain.js
- tensorflow.js
- ml.js
- ml5
NLP
- natural.js
- compromise.js
- nlp.js
These are some of the libraries and packages.Let us know the ones you can add to this list.
Data Wrangling and Manipulation with Data-Forge
Data-Forge is a JavaScript data transformation and analysis toolkit inspired by Pandas and LINQ created by Ashley Davis. It makes data wrangling very easy.
To install it on your system you can use npm package manager as below. First of all we will create a folder where we will be running and writing our code. You can also use this package in the data-forge notebook software.
Installation & Setup
mkdir dataforgeTut
cd dataforgeTut
npm init -y
This will create a package.json file where we can use to track all the packages we will be using. We will then install data-forge and data-forge-fs for working with files.
npm install data-forge data-forge-fs
Next we can create an index.js file were we will run all our code.
Just like Pandas we can use Data-Forge to create dataframes or read in data from CSV files, JSON files and txt files as below.
// import package
const dataForge = require('data-forge');require('data-forge-fs')
Creating DataFrames in DataForge
To Create a dataframe you can use this
// Create A DataFrame

const df = new dataForge.DataFrame({
    columnNames:["id","name","sex","age"],
    rows:[
        [1,"Jesse","male",25],
        [2,"Jane","female",25],
        [3,"Mark","male",20],
        [4,"Peter","male",55],
        [5,"Paula","female",35],

    ]
})
console.log(df)
How to Read Data From CSV Files
With data-forge you can read data from csv files using two methods. The first method is by using the default nodejs filesystem package (‘fs’) and then parsing the results to data-forge.fromCSV() function.
const fs = require('fs')
const dataforge = require('data-forge')

const text = fs.readFileSync('iris.csv', 'utf-8')
const df = dataforge
      .fromCSV(text)

// Display Results as Array
console.log(df.toArray())
Alternatively you can use data-forge-fs to read files directly as below.
const df = dataForge.readFileSync('mydata.csv').parseCSV();You can check out the various things we can do with dataforge using console.dir() or Objects.keys() functions
console.dir(dataforge);{
Index: [Function: Index],
Series: [Function: Series] {
initFromArray: [Function (anonymous)],
initEmpty: [Function (anonymous)],
checkIterable: [Function (anonymous)],
initFromConfig: [Function (anonymous)],
merge: [Function (anonymous)],
count: [Function (anonymous)],
parseInt: [Function (anonymous)],
parseFloat: [Function (anonymous)],
parseDate: [Function (anonymous)],
toString: [Function (anonymous)],
sum: [Function (anonymous)],
average: [Function (anonymous)],
median: [Function (anonymous)],
std: [Function (anonymous)],
min: [Function (anonymous)],
max: [Function (anonymous)],
concat: [Function (anonymous)],
zip: [Function (anonymous)],
defaultCountIterable: CountIterable {},
defaultEmptyIterable: EmptyIterable {}
},
DataFrame: [Function: DataFrame] {
initFromArray: [Function (anonymous)],
initEmpty: [Function (anonymous)],
initColumnNames: [Function (anonymous)],
checkIterable: [Function (anonymous)],
initFromConfig: [Function (anonymous)],
merge: [Function (anonymous)],
concat: [Function (anonymous)],
zip: [Function (anonymous)],
deserialize: [Function (anonymous)],
defaultCountIterable: CountIterable {},
defaultEmptyIterable: EmptyIterable {}
},
fromObject: [Function: fromObject],
fromJSON: [Function: fromJSON],
fromJSON5: [Function: fromJSON5],
fromCSV: [Function: fromCSV],
concatSeries: [Function (anonymous)],
zipSeries: [Function (anonymous)],
range: [Function: range],
replicate: [Function: replicate],
matrix: [Function: matrix]
}
Just like Pandas we can check for the head,tail,column names, datatypes, summary and more.
// Get  Head (first 5 rows)
console.log(df.head(5).toString())

// Get Tail
console.log(df.tail(5).toString())

// Get DataTypes
console.log(df.detectTypes().toString())

// Get Values
console.log(df.detectValues().toString())

// Describe/Summary
console.log(df.summarize())

// Get Column Names
console.log(df.getColumnNames())

// Rename Column Names
let df2 = df.renameSeries({"species":"class"})
console.log(df2.getColumnNames())

// Number of Rows
console.log(df.count())
Selection of Rows and Columns Using Data Forge
// Selection of Rows
// pandas : df.iloc[10]
console.log(df.at(10))

// // For several rows
// pandas:: df.loc[:,10:20]
console.log(df.between(10,20).toString())

// Skip and Take
console.log(df.skip(10).take(20).toString())
Selection of Columns
// Selection of Columns
// pandas: df['col1'] or df.col1
// Method: getSeries
console.log(df.getSeries('species').toString())

// Method 2: deflate
let colSpecies = df.deflate(row=>row.species)
console.log(colSpecies.toString())

// Select Multiple Columns
console.log(df.subset(['sepal_length','species']).toString())

// Delete Columns
console.log(df.dropSeries('sepal_length').head(5).toString())

// Delete Multiple COlumns
console.log(df.dropSeries(['sepal_length','species']).head(5).toString())
Filtering and Data Transformation with Data-Forge
Data-forge provides the .where() and .transformSeries() for filtering and transforming data respectively.
// Filtering
console.log(df.where(row=>row['sepal_width'] > 1.3).toString())

// Modify or Transform a Column
console.log(df.transformSeries({species: value => value.toUpperCase()}).toString())

// Distinct/Unique
console.log(df.distinct(row => row.species).toString())


// Method 2: Transform

let slLength = df.getSeries("sepal_length")
slLength.select(value=> value + 2.5).toString()

console.log(df.withSeries("sepal_length",slLength).toString())
Using Group By In Data-Forge
We can also use groupby in data-forge to even do value counts as below
// // GroupBy
// Value Counts
let speciesGroups = df.groupBy(row => row.species).select(
     group=>{
         return{
             species:group.first().species,
             Count:group.count()
         }
     }).inflate();

console.log(speciesGroups.toArray())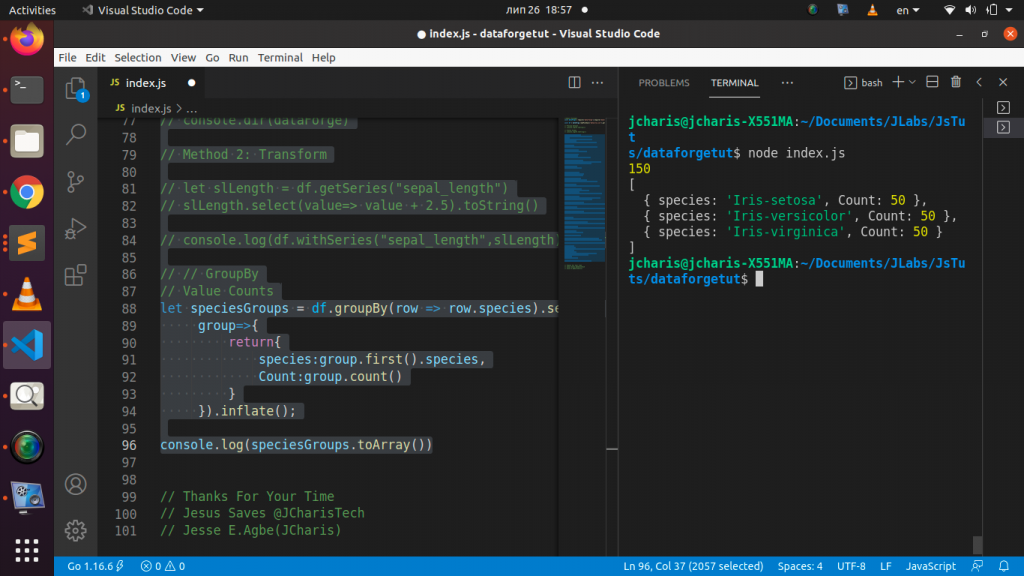
There are also several features and functionality such as merge, join,concat, orderby,select, etc in data-forge.js .
Below is a video tutorial that you can check out
Thanks for your time
Jesus Save @JCharisTech
By Jesse E.Agbe(JCharis)
Thanks for this post. It is quite helpful. Can you please share video link too. Seems like it is missing.
Okay ,You can check it out here https://youtu.be/k0mx-bNOtJA.
Hope this helps
Thank you for this awesome blog. You are giving a professional touch to your content. It makes your article worth reading. Looking forward to learn more from you.
Thanks a lot Hazel, glad they are helpful