
Building Machine learning models can be time consuming and tedious,but with the advent of Auto ML services and application we can reduce our burden . In this tutorial we will be building a Semi – Automated ML app with streamlit. It is going to be a drag and drop machine learning app that features
- Exploratory Data Analysis
- Data Visualization
- Model Building
Let us see how to build this ML app. For more on building ML apps you can check here
Installation
We will be using streamlit version -0.52.1 and upwards to help us build our app. This is because the drag and drop feature is available only from version 0.52 and upwards.
pip install streamlit==0.52.1
We will also need to install some other packages ,if you do not have it such as (pandas,sklearn,etc)
pip install pandas numpy scikit-learn matplotlib seaborn joblib
The basic structure of our app will be of 4 parts or sections. These section are the various activities we can do with the app.
We will have our main function that contains our four sections.
- EDA aspect for exploratory data analysis
- Plot aspect for Data Visualization
- Model Building for building our ML models using 5 algorithms
- About: A simple about page
Designing the Drag and Drop
We will be using the st.file_uploader() from streamlit for our drag and drop feature as follows.
data = st.file_uploader("Upload a Dataset", type=["csv", "txt"])
We will then set the type of files to upload to a specific file type for security reasons. In our case we will be only accepting csv and txt files.
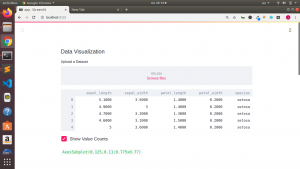
Data Visualization
We will be using matplotlib and seaborn to make our data visualization and plots.
Streamlit has several plots we will be using in our app such as st.area_chart,st.line_chart,st.bar_chart,etc. Any other charts can also be plotted using the st,pyplot() function.
Model Building
We will build different models using ML algorithms from the scikit-learn package and then compare the results to find the best.
Below is the code for the entire app
# Core Pkgs
import streamlit as st
# EDA Pkgs
import pandas as pd
import numpy as np
# Data Viz Pkg
import matplotlib.pyplot as plt
import matplotlib
matplotlib.use("Agg")
import seaborn as sns
# ML Packages
from sklearn import model_selection
from sklearn.linear_model import LogisticRegression
from sklearn.tree import DecisionTreeClassifier
from sklearn.neighbors import KNeighborsClassifier
from sklearn.discriminant_analysis import LinearDiscriminantAnalysis
from sklearn.naive_bayes import GaussianNB
from sklearn.svm import SVC
def main():
"""Semi Automated ML App with Streamlit """
activities = ["EDA","Plots","Model Building","About"]
choice = st.sidebar.selectbox("Select Activities",activities)
if choice == 'EDA':
st.subheader("Exploratory Data Analysis")
data = st.file_uploader("Upload a Dataset", type=["csv", "txt"])
if data is not None:
df = pd.read_csv(data)
st.dataframe(df.head())
if st.checkbox("Show Shape"):
st.write(df.shape)
if st.checkbox("Show Columns"):
all_columns = df.columns.to_list()
st.write(all_columns)
if st.checkbox("Summary"):
st.write(df.describe())
if st.checkbox("Show Selected Columns"):
selected_columns = st.multiselect("Select Columns",all_columns)
new_df = df[selected_columns]
st.dataframe(new_df)
if st.checkbox("Show Value Counts"):
st.write(df.iloc[:,-1].value_counts())
if st.checkbox("Correlation Plot(Matplotlib)"):
plt.matshow(df.corr())
st.pyplot()
if st.checkbox("Correlation Plot(Seaborn)"):
st.write(sns.heatmap(df.corr(),annot=True))
st.pyplot()
if st.checkbox("Pie Plot"):
all_columns = df.columns.to_list()
column_to_plot = st.selectbox("Select 1 Column",all_columns)
pie_plot = df[column_to_plot].value_counts().plot.pie(autopct="%1.1f%%")
st.write(pie_plot)
st.pyplot()
elif choice == 'Plots':
st.subheader("Data Visualization")
data = st.file_uploader("Upload a Dataset", type=["csv", "txt"])
if data is not None:
df = pd.read_csv(data)
st.dataframe(df.head())
if st.checkbox("Show Value Counts"):
st.write(df.iloc[:,-1].value_counts().plot(kind='bar'))
st.pyplot()
# Customizable Plot
all_columns_names = df.columns.tolist()
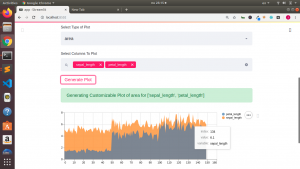
type_of_plot = st.selectbox("Select Type of Plot",["area","bar","line","hist","box","kde"])
selected_columns_names = st.multiselect("Select Columns To Plot",all_columns_names)
if st.button("Generate Plot"):
st.success("Generating Customizable Plot of {} for {}".format(type_of_plot,selected_columns_names))
# Plot By Streamlit
if type_of_plot == 'area':
cust_data = df[selected_columns_names]
st.area_chart(cust_data)
elif type_of_plot == 'bar':
cust_data = df[selected_columns_names]
st.bar_chart(cust_data)
elif type_of_plot == 'line':
cust_data = df[selected_columns_names]
st.line_chart(cust_data)
# Custom Plot
elif type_of_plot:
cust_plot= df[selected_columns_names].plot(kind=type_of_plot)
st.write(cust_plot)
st.pyplot()
elif choice == 'Model Building':
st.subheader("Building ML Models")
data = st.file_uploader("Upload a Dataset", type=["csv", "txt"])
if data is not None:
df = pd.read_csv(data)
st.dataframe(df.head())
# Model Building
X = df.iloc[:,0:-1]
Y = df.iloc[:,-1]
seed = 7
# prepare models
models = []
models.append(('LR', LogisticRegression()))
models.append(('LDA', LinearDiscriminantAnalysis()))
models.append(('KNN', KNeighborsClassifier()))
models.append(('CART', DecisionTreeClassifier()))
models.append(('NB', GaussianNB()))
models.append(('SVM', SVC()))
# evaluate each model in turn
model_names = []
model_mean = []
model_std = []
all_models = []
scoring = 'accuracy'
for name, model in models:
kfold = model_selection.KFold(n_splits=10, random_state=seed)
cv_results = model_selection.cross_val_score(model, X, Y, cv=kfold, scoring=scoring)
model_names.append(name)
model_mean.append(cv_results.mean())
model_std.append(cv_results.std())
accuracy_results = {"model name":name,"model_accuracy":cv_results.mean(),"standard deviation":cv_results.std()}
all_models.append(accuracy_results)
if st.checkbox("Metrics As Table"):
st.dataframe(pd.DataFrame(zip(model_names,model_mean,model_std),columns=["Algo","Mean of Accuracy","Std"]))
if st.checkbox("Metrics As JSON"):
st.json(all_models)
elif choice == 'About':
st.subheader("About")
if __name__ == '__main__':
main()
You can also check out the entire video tutorial here
Get more on our course on udemy here
Thanks a lot for your time
Jesus Saves
By Jesse E.Agbe(JCharis)