Exploring your dataset is an essential aspect of every data science task or project. As an aspect of the Data Science Life Cycle , it allows you to derive descriptive and practical insight into what your data comprises of.
It is essential to know how to derive such insight from your data by creating your own functions using the available tools such as pandas, pyspark, datatables,numpy etc. as well as several data visualization libraries such as the famous matplotlib, the colorful seaborn, the interactive plotly and bokeh, and the amazing altair and vega.
To be frank, EDA can be time consuming and can become repetitive at times. But in case you want to speed up this process of the Data Science Life Cycle, there are 3 useful EDA tools that can do the job.
Let us explore these tools namely
- Pandas Profiling
- Sweetviz
- Dtale
Using Pandas Profiling
Pandas Profiling is an Open source library for generating EDA profile reports and more. To Install it you can just use pip as follows.
pip install pandas-profilingTo work with pandas -profiling it is quite simple. All you need is to pass in your dataframe from pandas.
# Load EDA Pkgs
import pandas as pd
df = pd.read_csv("your_dataset.csv")
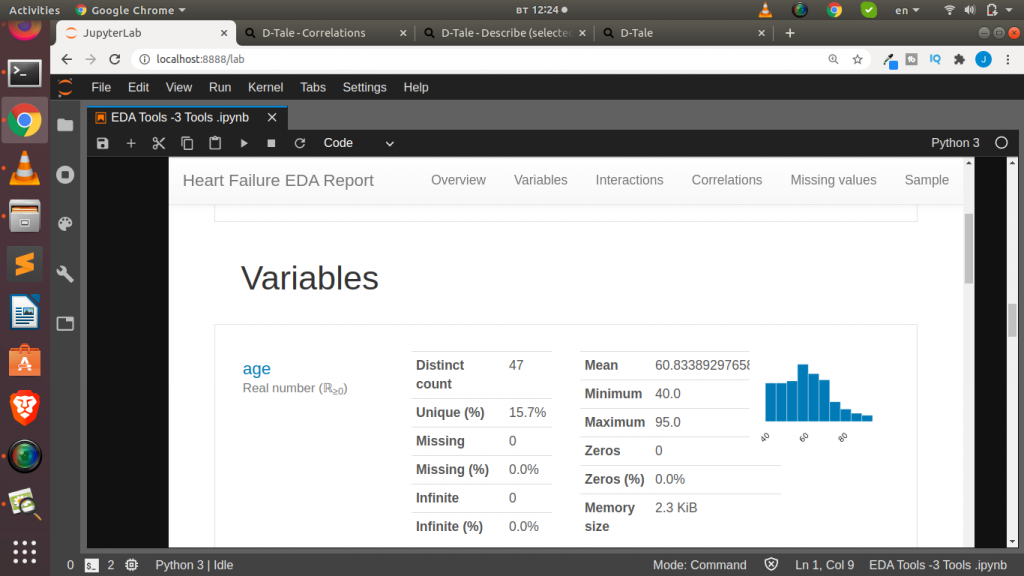
from pandas_profiling import ProfileReport
profile = ProfileReport(df,title='Your EDA Report')
# Method to View In Jupyter
profile.to_notebook_iframe()
# Method to Save as HTML
profile.to_file("your_eda_report.html")
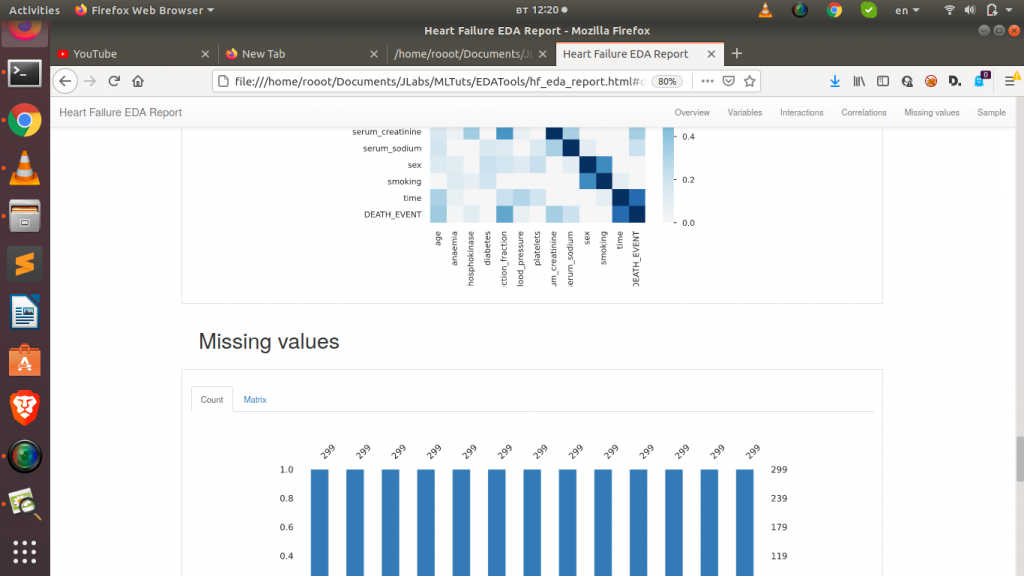
With these line of code we are able to generate an elaborate EDA profile report of our dataset. Cool right!!
Let us move on to the next.
Using Sweetviz
Sweetviz is also an Open source library for high density EDA visualization with simple code.To Install it you can just use pip as follows.
pip install sweetvizLike Pandas Profiling, you just need a few (actually 3) lines of code to generate an elaborative high density visual EDA report of your dataset. With Sweetviz you can even compare among dataset – which is useful for exploring your training and testing dataset in case you are building a model.
# Load Pkgs
import sweetviz as sv

# Analyse Dataset
report = sv.analyze(df)

# View and Save
report.show_html()
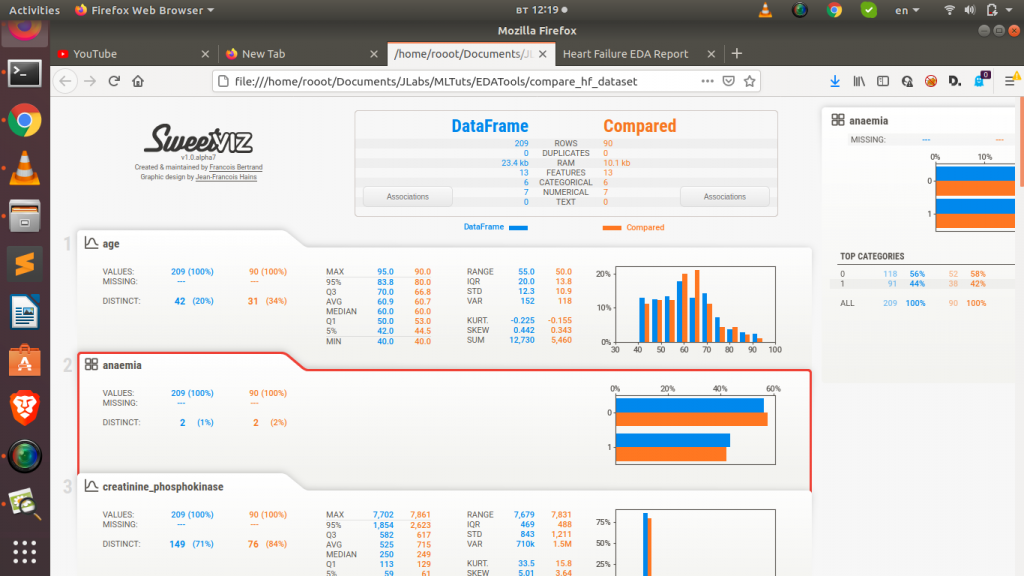
It will generate a full report in an html file in your current directory or otherwise. Sweet right! Let us move on to the next.
Using Dtale
D-Tale is the combination of a Flask back-end and a React front-end to bring you an easy way to view & analyze Pandas data structures. It is very detailed hence the name Dtale 🙂 . To install you can just use pip as always.
pip install dtaleSimilar to the 2 previous EDA tools, we just need 3 lines of code to generate a very detailed EDA report that is also interactive and editable.
Load the Pkgs
import dtale
d = dtale.show(df)
View Report
d
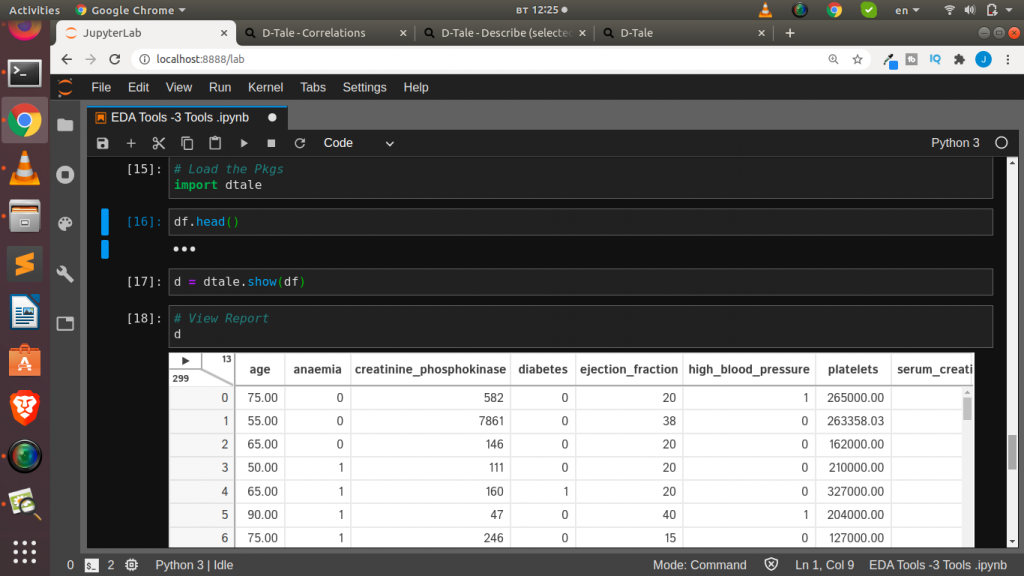
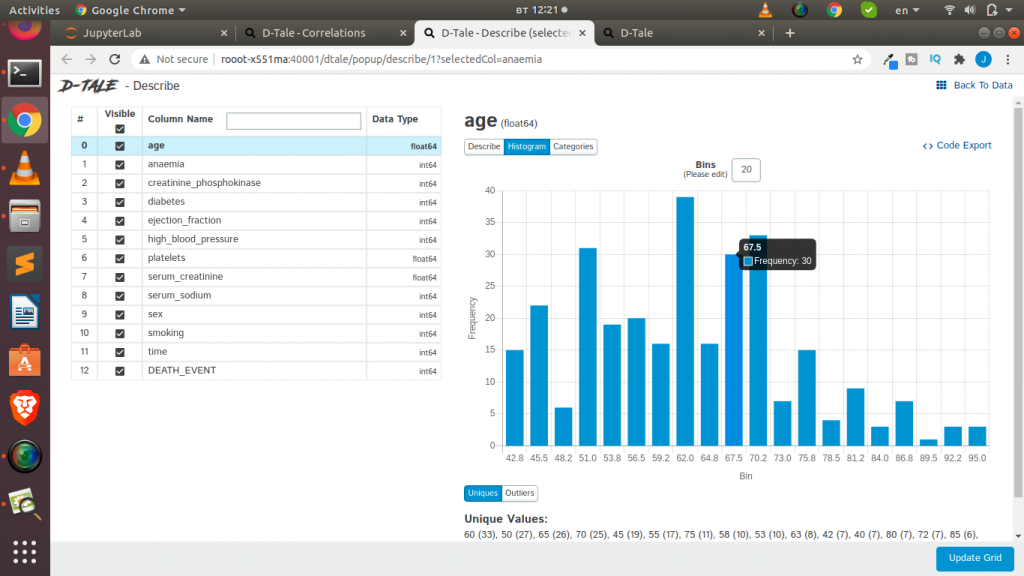
The cool thing about Dtale is that it offers the ability to see the code behind the particular visualization or EDA done. You can actual export the code used to generate a plot or an analysis. Which is very cool and helpful. Awesome right.
So to conclude, we have seen how to use 3 Powerful EDA Libraries to gather insight from our dataset. Let us know what you do with these tools.
Happy EDA
Thanks For Your Time
Jesus Saves
By Jesse E.Agbe(JCharis)