Knowledge graphs are powerful tools for representing and organizing complex information in a structured, interconnected way. They have gained significant traction in recent years due to their ability to capture relationships between entities and provide context-rich data representations. This article will explore knowledge graphs in depth, including their applications and implementation in Python.
What are Knowledge Graphs?
A knowledge graph is a structured representation of information that uses a graph-based data model to capture entities (nodes) and the relationships (edges) between them[1]. Unlike traditional relational databases, knowledge graphs allow for flexible and dynamic connections between data points, making them ideal for representing complex, interconnected information.
Key components of a knowledge graph include:
- Nodes: Represent entities or concepts
- Edges: Represent relationships between nodes
- Properties: Additional attributes associated with nodes or edges
Knowledge graphs often incorporate semantic technologies, allowing for more meaningful and context-aware data representation. They can integrate data from multiple sources and domains, creating a unified view of information[1].
Applications of Knowledge Graphs
Knowledge graphs have found applications across various industries and domains:
1. Search Engines and Information Retrieval
Search engines like Google use knowledge graphs to enhance search results by providing contextual information and answering queries directly[1]. This allows users to get relevant information without having to click through multiple web pages.
2. Recommendation Systems
E-commerce platforms and streaming services utilize knowledge graphs to provide personalized recommendations by analyzing user preferences and item relationships[2].
3. Healthcare and Life Sciences
Knowledge graphs help in drug discovery, patient care, and medical research by integrating diverse biomedical data sources and revealing hidden connections between diseases, genes, and treatments[9].
4. Financial Services
Banks and financial institutions use knowledge graphs for fraud detection, risk assessment, and regulatory compliance by analyzing complex relationships between entities and transactions[6].
5. Enterprise Knowledge Management
Organizations leverage knowledge graphs to integrate and manage diverse data sources, improving information discovery and decision-making processes[2].
6. Natural Language Processing (NLP)
Knowledge graphs enhance NLP applications by providing context and understanding relationships between words, improving tasks like entity recognition, relation extraction, and text summarization[2].
7. Internet of Things (IoT)
Knowledge graphs help in managing and analyzing data from interconnected devices, enabling advanced IoT applications in areas like smart cities and energy management[9].
8. Cybersecurity
Security professionals use knowledge graphs to map historical cyber attacks, identify vulnerabilities, and enhance threat detection capabilities[13].
Implementing Knowledge Graphs in Python
Python offers several libraries and tools for working with knowledge graphs. Here’s a basic implementation using the nltk library:
import nltk
from nltk.tokenize import word_tokenize
from nltk.corpus import stopwords
import networkx as nx
import plotly.graph_objects as go
def build_knowledge_graph(text, target_word, window_size=5):
# Download necessary NLTK data
nltk.download('punkt')
nltk.download('stopwords')
# Tokenize the text and remove stopwords
tokens = word_tokenize(text.lower())
stop_words = set(stopwords.words('english'))
filtered_tokens = [token for token in tokens if token.isalnum() and token not in stop_words]
# Create a graph
G = nx.Graph()
# Add edges based on co-occurrence within the window
for i, token in enumerate(filtered_tokens):
if token == target_word.lower():
start = max(0, i - window_size)
end = min(len(filtered_tokens), i + window_size + 1)
for j in range(start, end):
if i != j:
G.add_edge(target_word, filtered_tokens[j])
return G
def plot_knowledge_graph(G, target_word):
# Get node positions
pos = nx.spring_layout(G)
# Create edge trace
edge_x = []
edge_y = []
for edge in G.edges():
x0, y0 = pos[edge[0]]
x1, y1 = pos[edge[1]]
edge_x.extend([x0, x1, None])
edge_y.extend([y0, y1, None])
edge_trace = go.Scatter(
x=edge_x, y=edge_y,
line=dict(width=0.5, color='#888'),
hoverinfo='none',
mode='lines')
# Create node trace
node_x = []
node_y = []
for node in G.nodes():
x, y = pos[node]
node_x.append(x)
node_y.append(y)
node_trace = go.Scatter(
x=node_x, y=node_y,
mode='markers+text',
hoverinfo='text',
marker=dict(
showscale=True,
colorscale='YlGnBu',
reversescale=True,
color=[],
size=10,
colorbar=dict(
thickness=15,
title='Node Connections',
xanchor='left',
titleside='right'
),
line_width=2))
# Color node points by the number of connections
node_adjacencies = []
node_text = []
for node in G.nodes():
adjacencies = list(G.adj[node])
node_adjacencies.append(len(adjacencies))
node_text.append(f'{node}<br># of connections: {len(adjacencies)}')
node_trace.marker.color = node_adjacencies
node_trace.text = node_text
# Create the figure
fig = go.Figure(data=[edge_trace, node_trace],
layout=go.Layout(
title=f'Knowledge Graph for "{target_word}"',
titlefont_size=16,
showlegend=False,
hovermode='closest',
margin=dict(b=20,l=5,r=5,t=40),
annotations=[dict(
text="",
showarrow=False,
xref="paper", yref="paper",
x=0.005, y=-0.002)],
xaxis=dict(showgrid=False, zeroline=False, showticklabels=False),
yaxis=dict(showgrid=False, zeroline=False, showticklabels=False))
)
return fig
def analyze_text_and_plot(text, target_word):
G = build_knowledge_graph(text, target_word)
fig = plot_knowledge_graph(G, target_word)
fig.show()
# Example usage
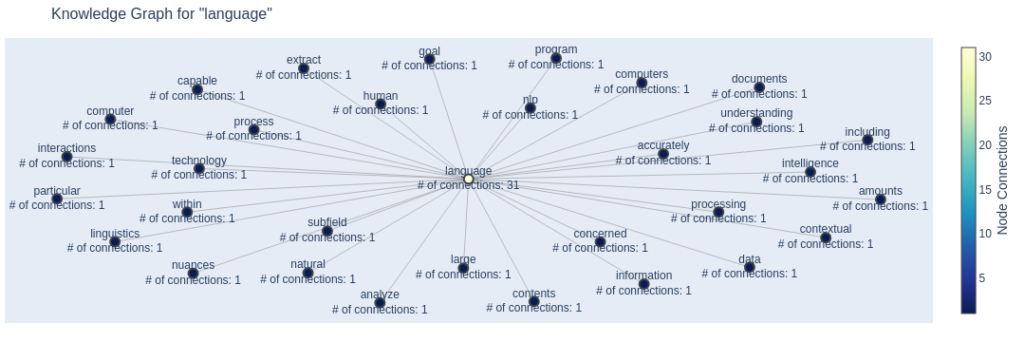
text = """
Natural language processing (NLP) is a subfield of linguistics, computer science, and artificial intelligence concerned with the interactions between computers and human language, in particular how to program computers to process and analyze large amounts of natural language data. The goal is a computer capable of understanding the contents of documents, including the contextual nuances of the language within them. The technology can then accurately extract information and insights contained in the documents as well as categorize and organize the documents themselves.
"""
analyze_text_and_plot(text, "language")
This code defines three main functions:
build_knowledge_graph(text, target_word, window_size=5): This function takes the input text, tokenizes it, removes stopwords, and builds a graph where the target word is connected to other words that appear within a specified window size.plot_knowledge_graph(G, target_word): This function takes the graph created by the previous function and creates a Plotly figure to visualize it.analyze_text_and_plot(text, target_word): This is the main function that combines the previous two functions. It builds the knowledge graph and then plots it using Plotly.
To use this code, you need to have the following libraries installed:
pip install nltk networkx plotly
The example usage at the end of the code demonstrates how to use the analyze_text_and_plot function.
For more advanced knowledge graph construction and querying, you can use libraries like:
- NetworkX: For graph algorithms and analysis
- Neo4j: A popular graph database with Python drivers
- SpaCy: For natural language processing and entity extraction
- LlamaIndex: For building and querying knowledge graphs from unstructured text
We can also use Spacy NER to even create a more insightful knowledge graph. Below is another implementation using spacy.
import spacy
import networkx as nx
import plotly.graph_objects as go
class SpacyKnowledgeGraph:
def __init__(self, model="en_core_web_sm"):
self.nlp = spacy.load(model)
def build_knowledge_graph(self, text, target_word):
doc = self.nlp(text)
G = nx.Graph()
for ent in doc.ents:
if ent.text.lower() == target_word.lower() or target_word.lower() in ent.text.lower():
G.add_node(ent.text, type=ent.label_)
# Connect the entity to other entities in the same sentence
for other_ent in doc.ents:
if other_ent != ent and ent.sent == other_ent.sent:
G.add_node(other_ent.text, type=other_ent.label_)
G.add_edge(ent.text, other_ent.text, type="co-occurrence")
# Connect the entity to important words in the same sentence
for token in ent.sent:
if token.pos_ in ["NOUN", "VERB", "ADJ"] and token.text.lower() != target_word.lower():
G.add_node(token.text, type=token.pos_)
G.add_edge(ent.text, token.text, type="related")
return G
def plot_knowledge_graph(self, G, target_word):
pos = nx.spring_layout(G)
edge_x, edge_y = [], []
for edge in G.edges():
x0, y0 = pos[edge[0]]
x1, y1 = pos[edge[1]]
edge_x.extend([x0, x1, None])
edge_y.extend([y0, y1, None])
edge_trace = go.Scatter(
x=edge_x, y=edge_y,
line=dict(width=0.5, color='#888'),
hoverinfo='none',
mode='lines')
node_x, node_y = [], []
for node in G.nodes():
x, y = pos[node]
node_x.append(x)
node_y.append(y)
node_trace = go.Scatter(
x=node_x, y=node_y,
mode='markers+text',
hoverinfo='text',
text=[f"{node}<br>{G.nodes[node]['type']}" for node in G.nodes()],
textposition="top center",
marker=dict(
showscale=True,
colorscale='YlGnBu',
reversescale=True,
color=[],
size=10,
colorbar=dict(
thickness=15,
title='Node Connections',
xanchor='left',
titleside='right'
),
line_width=2))
node_adjacencies = []
for node, adjacencies in G.adjacency():
node_adjacencies.append(len(adjacencies))
node_trace.marker.color = node_adjacencies
fig = go.Figure(data=[edge_trace, node_trace],
layout=go.Layout(
title=f'Knowledge Graph for "{target_word}"',
titlefont_size=16,
showlegend=False,
hovermode='closest',
margin=dict(b=20,l=5,r=5,t=40),
annotations=[dict(
text="",
showarrow=False,
xref="paper", yref="paper",
x=0.005, y=-0.002)],
xaxis=dict(showgrid=False, zeroline=False, showticklabels=False),
yaxis=dict(showgrid=False, zeroline=False, showticklabels=False))
)
return fig
def analyze_text_and_plot(self, text, target_word):
G = self.build_knowledge_graph(text, target_word)
fig = self.plot_knowledge_graph(G, target_word)
return fig
# Example usage
if __name__ == "__main__":
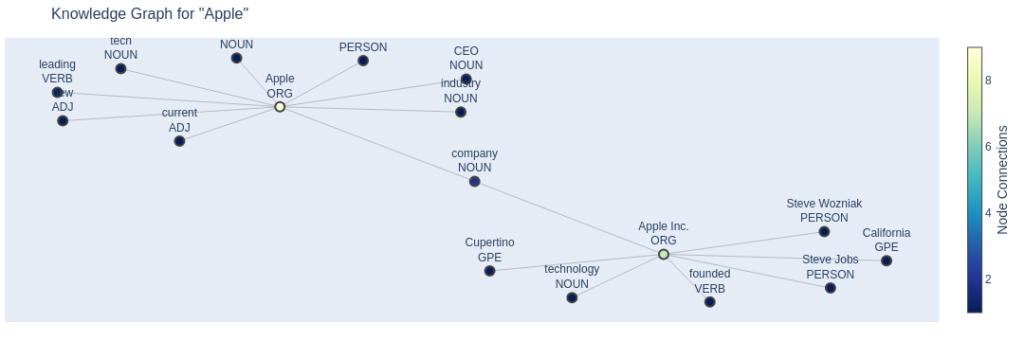
text = """
Apple Inc. is a technology company founded by Steve Jobs and Steve Wozniak in Cupertino, California.
The company is known for its innovative products like the iPhone, iPad, and MacBook.
Tim Cook is the current CEO of Apple, leading the company to new heights in the tech industry.
"""
knowledge_graph = SpacyKnowledgeGraph()
fig = knowledge_graph.analyze_text_and_plot(text, "Apple")
fig.show()
Conclusion
Knowledge graphs have emerged as a powerful tool for representing and analyzing complex, interconnected data. Their applications span across various industries, from enhancing search engines to powering advanced AI systems. As the volume and complexity of data continue to grow, knowledge graphs will play an increasingly important role in organizing and deriving insights from information.
Python, with its rich ecosystem of libraries and tools, provides a flexible and powerful platform for implementing and working with knowledge graphs. As the field evolves, we can expect to see more sophisticated tools and techniques for building, querying, and leveraging knowledge graphs in various applications.
Happy Coding
Jesus Saves
By JCharisAI