Clustering Countries into Continents using Unsupervised Machine Learning

Unsupervised Machine learning has several applications among them include its usage in identifying patterns and for clustering similar data into clusters or groups. In this tutorial we will see how to use unsupervised ML to perform a simple task of identifying the right continents a country belongs to given the longitude and the latitude.

Unsupervised Machine learning refers to the type of ML which looks for previously undetected patterns in a data set with no predefined labels or target value. In this case the dataset being used has no labels – ie there are only independent variables with no dependent target or labels and our task is to detect the labels without any human supervision. Hence the term unsupervised – as there is usually little to no human to label the data being used.

There are several algorithms that are used in unsupervised ML, these include

  • Clustering
  • Anomaly Detection
  • Novelty Detection
  • Association Rules
  • Neural Network
  • PCA
  • Dimensionality Reduction:simplify data without losing too much info by merging correlated features into one
  • Association Rule Learning:discovering interesting relations between attributes

In our task we will be using clustering to help us solve our challenge.

So what is Clustering?

Clustering refers to the process of grouping or segmenting unlabelled datasets into similar groups(clusters) that share similar attributes or features. It is almost like classification except that it is used in unsupervised ML unlike classification that is used in Supervised ML (data that has been labelled). In another tutorial we will discuss the difference.

There are several approaches for clustering unlabelled data. All of these approaches basically deals with the different type of distances between the individual data points such as euclidean distance,graph distance,etc.

Types of Clustering

Clustering can be grouped as either

  • Flat or Hierarchical
  • Centroid Based or Density Based

The various algorithms used in clustering based on the basic principle of distance include;

  • K-Means (distance between points)
  • Hierarchical Clustering
  • Affinity propagation (graph distance)
  • Mean-shift (distance between points)
  • DBSCAN (distance between nearest points),
  • Gaussian mixtures (Mahalanobis distance to centers),
  • Spectral clustering (graph distance), etc.
  • BIRCH
  • etc

NB: You can check the full tutorial on most of these algorithms in here or the video.

Remember that our problem is to segment or cluster our unlabelled countries into their respective continents hence in our case we will be using K-Means Clustering Algorithm.

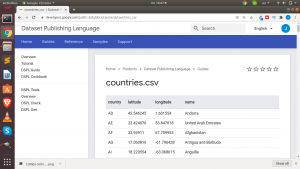
Let us start with our task. Below is the preview of the dataset that we are working with As you can see there are only the country name and their coordinates but what we need is to have an additional column that shows which country each continent belongs to.

You can check the original dataset here.

We will be using scikit-learn,pandas and matplotlib for our task.


Let us see the workflow of our task

Problem: cluster countries into their respective continents

Steps

  1. Fetch and Prep the Data
  2. Visualize the Data using Scatter Plots
  3. Identify the Number of K- Clusters we need to group into (In our case we know by general knowledge that there are 7 continents)
  4. Build our KMeans Model
  5. Cluster our data into their respective continents
  6. Overlap our result over world map using geopandas
  7. Relabel them in plain English

Below is the entire code for our task.

# Load EDA Pkgs
import pandas as pd
import numpy as np
In [2]:
# Load Visualization
import matplotlib.pyplot as plt
import seaborn as sns
%matplotlib inline
/usr/local/lib/python3.7/dist-packages/statsmodels/tools/_testing.py:19: FutureWarning: pandas.util.testing is deprecated. Use the functions in the public API at pandas.testing instead.
  import pandas.util.testing as tm

Preparing the Data

In [8]:
# Load Dataset
df = pd.read_csv("countries_geodata.csv",sep='\t')
In [9]:
df.head()
Out[9]:
country latitude longitude name
0 AD 42.546245 1.601554 Andorra
1 AE 23.424076 53.847818 United Arab Emirates
2 AF 33.939110 67.709953 Afghanistan
3 AG 17.060816 -61.796428 Antigua and Barbuda
4 AI 18.220554 -63.068615 Anguilla
In [10]:
# Save to CSV
df.to_csv("countries_data.csv")
In [11]:
df.head()
Out[11]:
country latitude longitude name
0 AD 42.546245 1.601554 Andorra
1 AE 23.424076 53.847818 United Arab Emirates
2 AF 33.939110 67.709953 Afghanistan
3 AG 17.060816 -61.796428 Antigua and Barbuda
4 AI 18.220554 -63.068615 Anguilla
In [12]:
# Check For Dtypes
df.dtypes
Out[12]:
country       object
latitude     float64
longitude    float64
name          object
dtype: object
In [13]:
# Check For Missing NAN
df.isnull().sum()
Out[13]:
country      1
latitude     1
longitude    1
name         0
dtype: int64
In [14]:
# Drop Na
df = df.dropna()
In [15]:
df.isnull().sum()
Out[15]:
country      0
latitude     0
longitude    0
name         0
dtype: int64
In [16]:
# Columns Consistency
df.columns
Out[16]:
Index(['country', 'latitude', 'longitude', 'name'], dtype='object')
In [18]:
# Check For Countries
df.shape
Out[18]:
(243, 4)
Data Visualization using Scatter plot
In [19]:
# Plot of our Countries 
plt.scatter(df['longitude'],df['latitude'])
Out[19]:
<matplotlib.collections.PathCollection at 0x7fa0491a31d0>

Working with Kmeans

In [20]:
from sklearn.cluster import KMeans
In [22]:
# By Assumation we have 7 continents
# k = 7
km = KMeans(n_clusters=7)
In [24]:
# Prep
xfeatures = df[['longitude','latitude']]
In [25]:
# Fit n Predict
clusters = km.fit_predict(xfeatures)
In [26]:
# Get all the Labels(Clusters)
km.labels_
Out[26]:
array([6, 2, 2, 0, 0, 6, 2, 0, 4, 4, 0, 3, 6, 5, 0, 2, 6, 0, 1, 6, 4, 6,
       2, 4, 4, 0, 1, 0, 0, 0, 1, 4, 4, 6, 0, 0, 1, 4, 4, 4, 6, 4, 3, 0,
       4, 1, 0, 0, 0, 6, 1, 2, 6, 6, 2, 6, 0, 0, 6, 0, 6, 2, 6, 2, 6, 2,
       6, 5, 0, 5, 6, 6, 4, 6, 0, 2, 0, 6, 4, 6, 6, 6, 4, 0, 4, 6, 4, 0,
       5, 6, 0, 2, 1, 4, 0, 6, 0, 6, 1, 6, 2, 6, 1, 1, 2, 2, 6, 6, 6, 0,
       2, 1, 4, 2, 1, 3, 4, 0, 1, 1, 2, 0, 2, 1, 2, 0, 6, 1, 4, 4, 6, 6,
       6, 6, 6, 6, 6, 6, 4, 5, 6, 6, 1, 1, 1, 5, 0, 6, 0, 6, 4, 1, 4, 0,
       1, 4, 5, 6, 5, 4, 0, 6, 6, 1, 5, 3, 5, 2, 0, 0, 3, 5, 1, 2, 6, 0,
       3, 0, 2, 6, 5, 0, 2, 4, 6, 6, 1, 4, 2, 5, 2, 2, 6, 1, 4, 6, 6, 6,
       4, 6, 6, 2, 0, 4, 0, 2, 4, 0, 4, 4, 4, 1, 2, 3, 5, 2, 6, 3, 2, 0,
       5, 1, 4, 6, 4, 0, 0, 2, 6, 0, 0, 0, 0, 1, 5, 3, 3, 6, 2, 4, 4, 4,
       4], dtype=int32)
In [27]:
clusters
Out[27]:
array([6, 2, 2, 0, 0, 6, 2, 0, 4, 4, 0, 3, 6, 5, 0, 2, 6, 0, 1, 6, 4, 6,
       2, 4, 4, 0, 1, 0, 0, 0, 1, 4, 4, 6, 0, 0, 1, 4, 4, 4, 6, 4, 3, 0,
       4, 1, 0, 0, 0, 6, 1, 2, 6, 6, 2, 6, 0, 0, 6, 0, 6, 2, 6, 2, 6, 2,
       6, 5, 0, 5, 6, 6, 4, 6, 0, 2, 0, 6, 4, 6, 6, 6, 4, 0, 4, 6, 4, 0,
       5, 6, 0, 2, 1, 4, 0, 6, 0, 6, 1, 6, 2, 6, 1, 1, 2, 2, 6, 6, 6, 0,
       2, 1, 4, 2, 1, 3, 4, 0, 1, 1, 2, 0, 2, 1, 2, 0, 6, 1, 4, 4, 6, 6,
       6, 6, 6, 6, 6, 6, 4, 5, 6, 6, 1, 1, 1, 5, 0, 6, 0, 6, 4, 1, 4, 0,
       1, 4, 5, 6, 5, 4, 0, 6, 6, 1, 5, 3, 5, 2, 0, 0, 3, 5, 1, 2, 6, 0,
       3, 0, 2, 6, 5, 0, 2, 4, 6, 6, 1, 4, 2, 5, 2, 2, 6, 1, 4, 6, 6, 6,
       4, 6, 6, 2, 0, 4, 0, 2, 4, 0, 4, 4, 4, 1, 2, 3, 5, 2, 6, 3, 2, 0,
       5, 1, 4, 6, 4, 0, 0, 2, 6, 0, 0, 0, 0, 1, 5, 3, 3, 6, 2, 4, 4, 4,
       4], dtype=int32)
In [30]:
# Check if predicted clusters is the same as our labels
clusters is km.labels_
Out[30]:
True
In [31]:
# Centroid/Center
km.cluster_centers_
Out[31]:
array([[ -70.34407094,    9.8465647 ],
       [ 103.45510325,   18.34838525],
       [  47.93853438,   28.52611853],
       [-164.167216  ,  -15.7990057 ],
       [  20.38957626,  -11.53326343],
       [ 156.84523619,   -7.98094281],
       [   7.80604397,   44.17186475]])
In [32]:
# Store and Map
df['cluster_continents'] = clusters
In [33]:
df.head()
Out[33]:
country latitude longitude name cluster_continents
0 AD 42.546245 1.601554 Andorra 6
1 AE 23.424076 53.847818 United Arab Emirates 2
2 AF 33.939110 67.709953 Afghanistan 2
3 AG 17.060816 -61.796428 Antigua and Barbuda 0
4 AI 18.220554 -63.068615 Anguilla 0
In [34]:
# Plot of our clusters
plt.scatter(df['longitude'],df['latitude'],c=df['cluster_continents'],cmap='rainbow')
Out[34]:
<matplotlib.collections.PathCollection at 0x7fa040e54310>
Overlaying our Plot on World Map using Geopandas
In [36]:
# Map our scatter plot over worldmap
import geopandas as gpd
from shapely.geometry import Point,Polygon
import descartes
In [38]:
# World Map
world = gpd.read_file(gpd.datasets.get_path('naturalearth_lowres'))
ax = world.plot(figsize=(20,10))
ax.axis('off')
Out[38]:
(-198.0, 198.00000000000006, -98.6822565, 92.32738650000002)
In [39]:
# Overlap our clusters
g01 = gpd.GeoDataFrame(df,geometry=gpd.points_from_xy(df['longitude'],df['latitude']))
In [40]:
g01
Out[40]:
country latitude longitude name cluster_continents geometry
0 AD 42.546245 1.601554 Andorra 6 POINT (1.60155 42.54624)
1 AE 23.424076 53.847818 United Arab Emirates 2 POINT (53.84782 23.42408)
2 AF 33.939110 67.709953 Afghanistan 2 POINT (67.70995 33.93911)
3 AG 17.060816 -61.796428 Antigua and Barbuda 0 POINT (-61.79643 17.06082)
4 AI 18.220554 -63.068615 Anguilla 0 POINT (-63.06862 18.22055)
240 YE 15.552727 48.516388 Yemen 2 POINT (48.51639 15.55273)
241 YT -12.827500 45.166244 Mayotte 4 POINT (45.16624 -12.82750)
242 ZA -30.559482 22.937506 South Africa 4 POINT (22.93751 -30.55948)
243 ZM -13.133897 27.849332 Zambia 4 POINT (27.84933 -13.13390)
244 ZW -19.015438 29.154857 Zimbabwe 4 POINT (29.15486 -19.01544)

243 rows × 6 columns

In [41]:
fig,ax = plt.subplots(figsize=(20,10))
g01.plot(cmap='rainbow',ax=ax)
world.geometry.boundary.plot(color=None,edgecolor='k',linewidth=2,ax=ax)
Out[41]:
<matplotlib.axes._subplots.AxesSubplot at 0x7fa0408b0d10>
In [42]:
# Plot of our clusters
plt.figure(figsize=(20,10))
plt.scatter(df['longitude'],df['latitude'],c=df['cluster_continents'],cmap='rainbow')
plt.show()
Mapping Our Clusters in Plain English
In [44]:
df.head(20)
Out[44]:
country latitude longitude name cluster_continents geometry
0 AD 42.546245 1.601554 Andorra 6 POINT (1.60155 42.54624)
1 AE 23.424076 53.847818 United Arab Emirates 2 POINT (53.84782 23.42408)
2 AF 33.939110 67.709953 Afghanistan 2 POINT (67.70995 33.93911)
3 AG 17.060816 -61.796428 Antigua and Barbuda 0 POINT (-61.79643 17.06082)
4 AI 18.220554 -63.068615 Anguilla 0 POINT (-63.06862 18.22055)
5 AL 41.153332 20.168331 Albania 6 POINT (20.16833 41.15333)
6 AM 40.069099 45.038189 Armenia 2 POINT (45.03819 40.06910)
7 AN 12.226079 -69.060087 Netherlands Antilles 0 POINT (-69.06009 12.22608)
8 AO -11.202692 17.873887 Angola 4 POINT (17.87389 -11.20269)
9 AQ -75.250973 -0.071389 Antarctica 4 POINT (-0.07139 -75.25097)
10 AR -38.416097 -63.616672 Argentina 0 POINT (-63.61667 -38.41610)
11 AS -14.270972 -170.132217 American Samoa 3 POINT (-170.13222 -14.27097)
12 AT 47.516231 14.550072 Austria 6 POINT (14.55007 47.51623)
13 AU -25.274398 133.775136 Australia 5 POINT (133.77514 -25.27440)
14 AW 12.521110 -69.968338 Aruba 0 POINT (-69.96834 12.52111)
15 AZ 40.143105 47.576927 Azerbaijan 2 POINT (47.57693 40.14310)
16 BA 43.915886 17.679076 Bosnia and Herzegovina 6 POINT (17.67908 43.91589)
17 BB 13.193887 -59.543198 Barbados 0 POINT (-59.54320 13.19389)
18 BD 23.684994 90.356331 Bangladesh 1 POINT (90.35633 23.68499)
19 BE 50.503887 4.469936 Belgium 6 POINT (4.46994 50.50389)
In [ ]:
continent_dict = {'South America':0,'North America':,'Asia':1,'Africa':4,'Australasia':5,'Europe':6}
In [53]:
df[df['cluster_continents'] == 3]
Out[53]:
country latitude longitude name cluster_continents geometry
11 AS -14.270972 -170.132217 American Samoa 3 POINT (-170.13222 -14.27097)
42 CK -21.236736 -159.777671 Cook Islands 3 POINT (-159.77767 -21.23674)
115 KI -3.370417 -168.734039 Kiribati 3 POINT (-168.73404 -3.37042)
166 NU -19.054445 -169.867233 Niue 3 POINT (-169.86723 -19.05445)
171 PF -17.679742 -149.406843 French Polynesia 3 POINT (-149.40684 -17.67974)
177 PN -24.703615 -127.439308 Pitcairn Islands 3 POINT (-127.43931 -24.70361)
214 TK -8.967363 -171.855881 Tokelau 3 POINT (-171.85588 -8.96736)
218 TO -21.178986 -175.198242 Tonga 3 POINT (-175.19824 -21.17899)
237 WF -13.768752 -177.156097 Wallis and Futuna 3 POINT (-177.15610 -13.76875)
238 WS -13.759029 -172.104629 Samoa 3 POINT (-172.10463 -13.75903)


You can see how we can practically use unsupervised machine learning to cluster countries into their respective continents. In an upcoming tutorial we will see how to use PyCaret to do the same task.

You can check the video tutorial on Unsupervised ML using Scikit Learn below.

Thank You For Your Time

Jesus Saves

By Jesse E.Agbe(JCharis)


Leave a Comment

Your email address will not be published. Required fields are marked *